Data Visualization
This page collects selected visualization work at the intersection of historical data, culture, and computational analysis.

Mapping five centuries of Korean history (2015)#
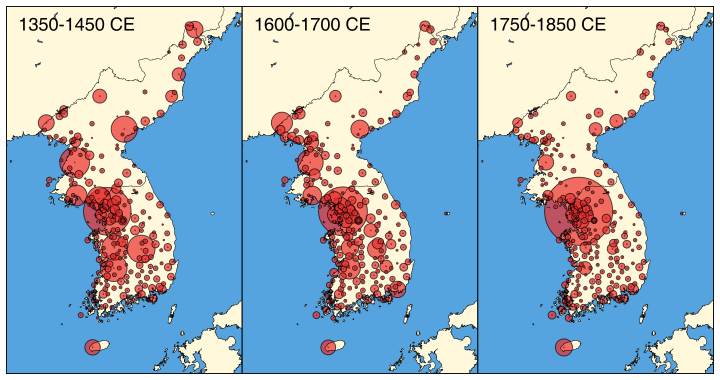
This visualization maps the geographic locations mentioned in the Veritable Records of the Joseon Dynasty (The Joseon wangjo sillok, 조선왕조실록), tracing how places emerge across five centuries of Korean history through historical records.
Data curation and visualization by Byunghwee Lee and Daniel Kim. (2015).
Project Notes#
- This project explores how historical texts can be transformed into spatial narratives.
- The visualization highlights the geographic distribution of places mentioned in the Joseon Dynasty annals over time.
- The place entities were collected using location tags embedded in the HTML of the Sillok records of the Joseon Dynasty. Their geographic coordinates (latitude and longitude) were manually annotated.
- It reveals which locations are most prominently mentioned in the historical record.
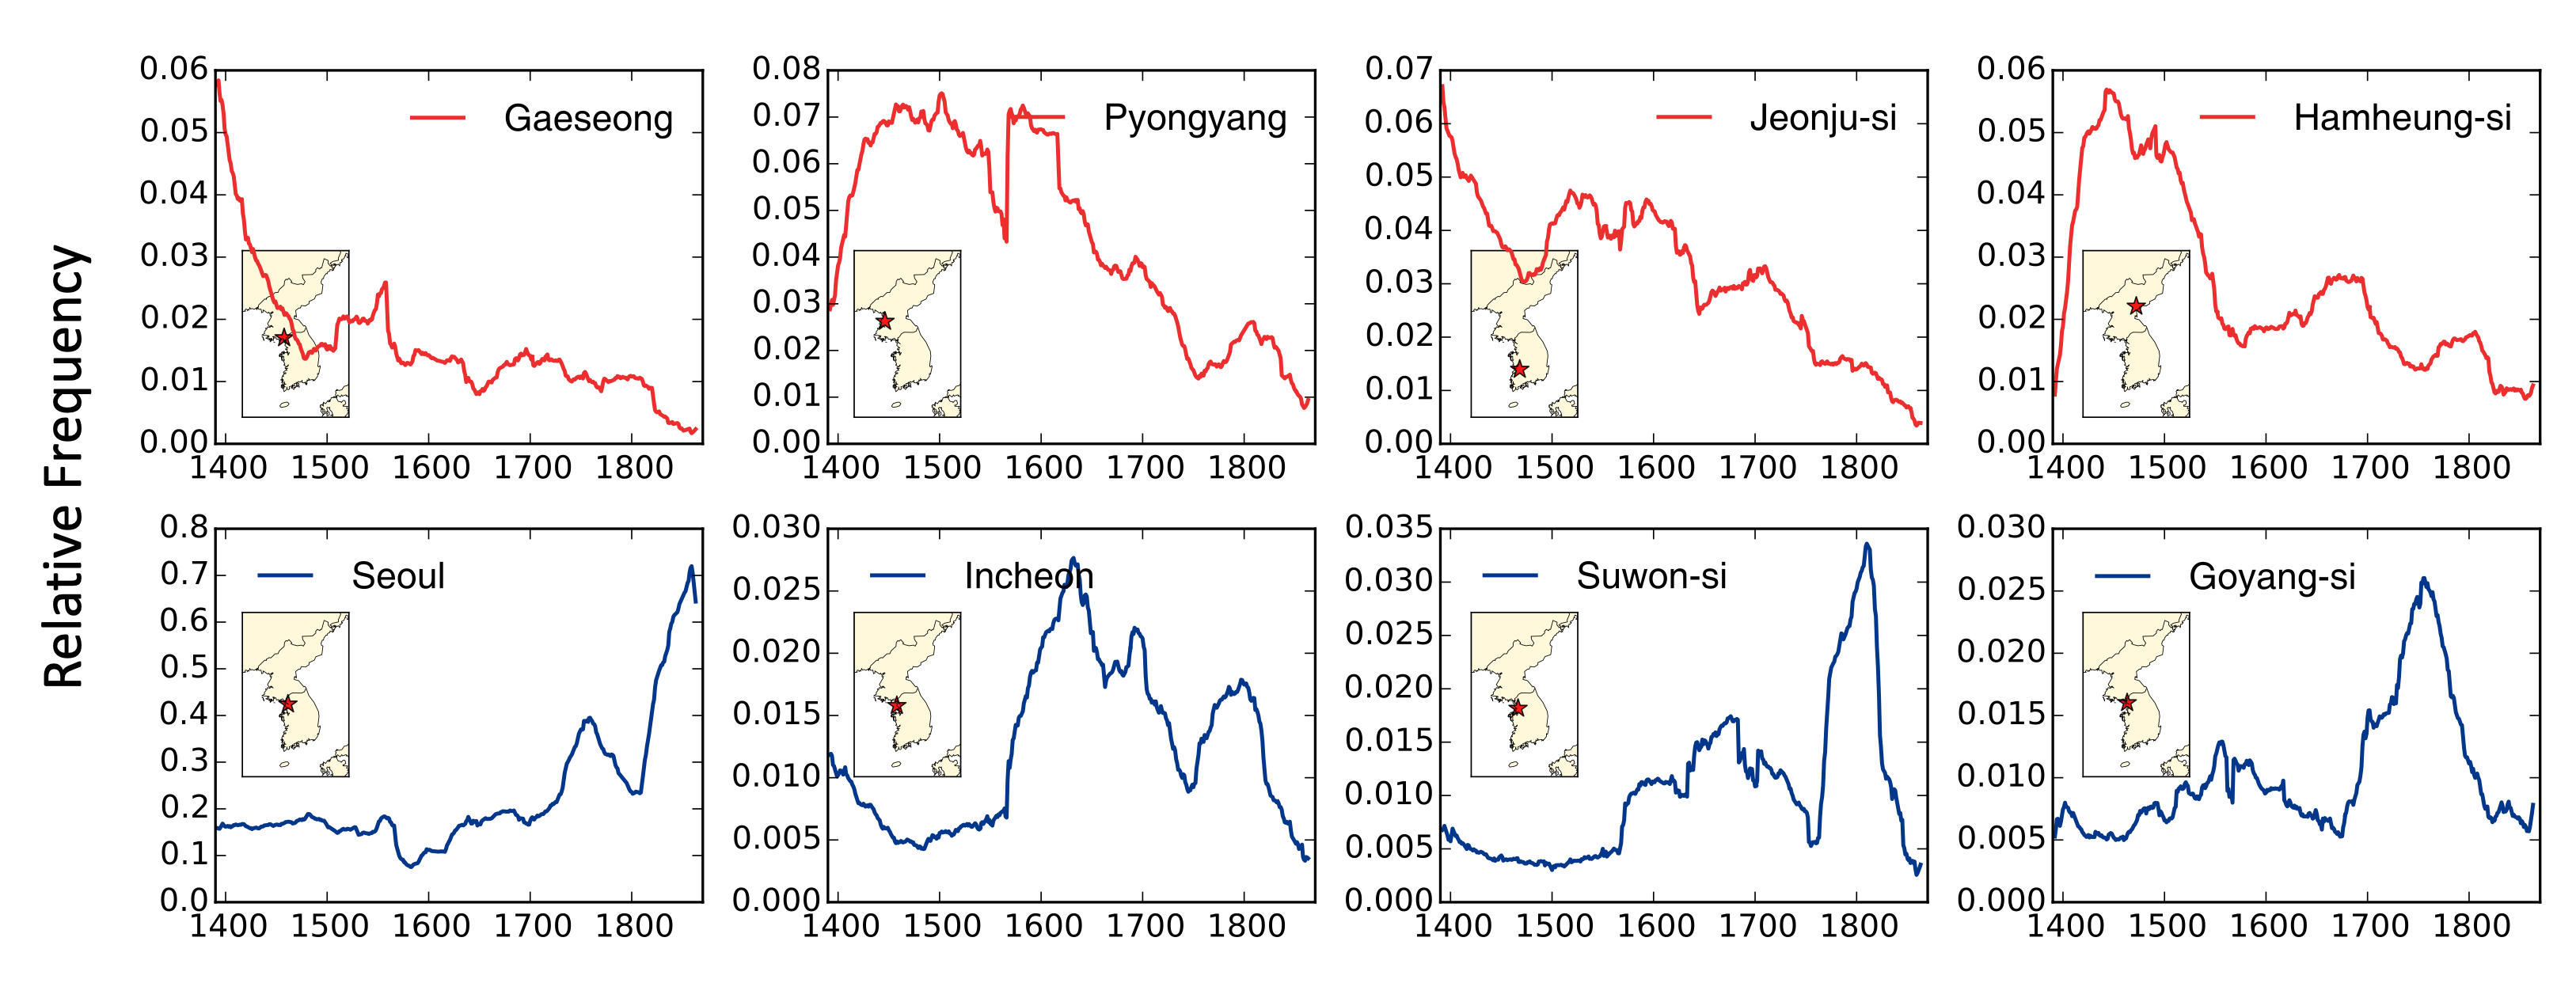
Increasing concentration of place mentions around Seoul in the historical text#
- A clear centralization toward Seoul is observed, with increasing mentions of cities around Seoul and a corresponding decline in mentions of peripheral regions.
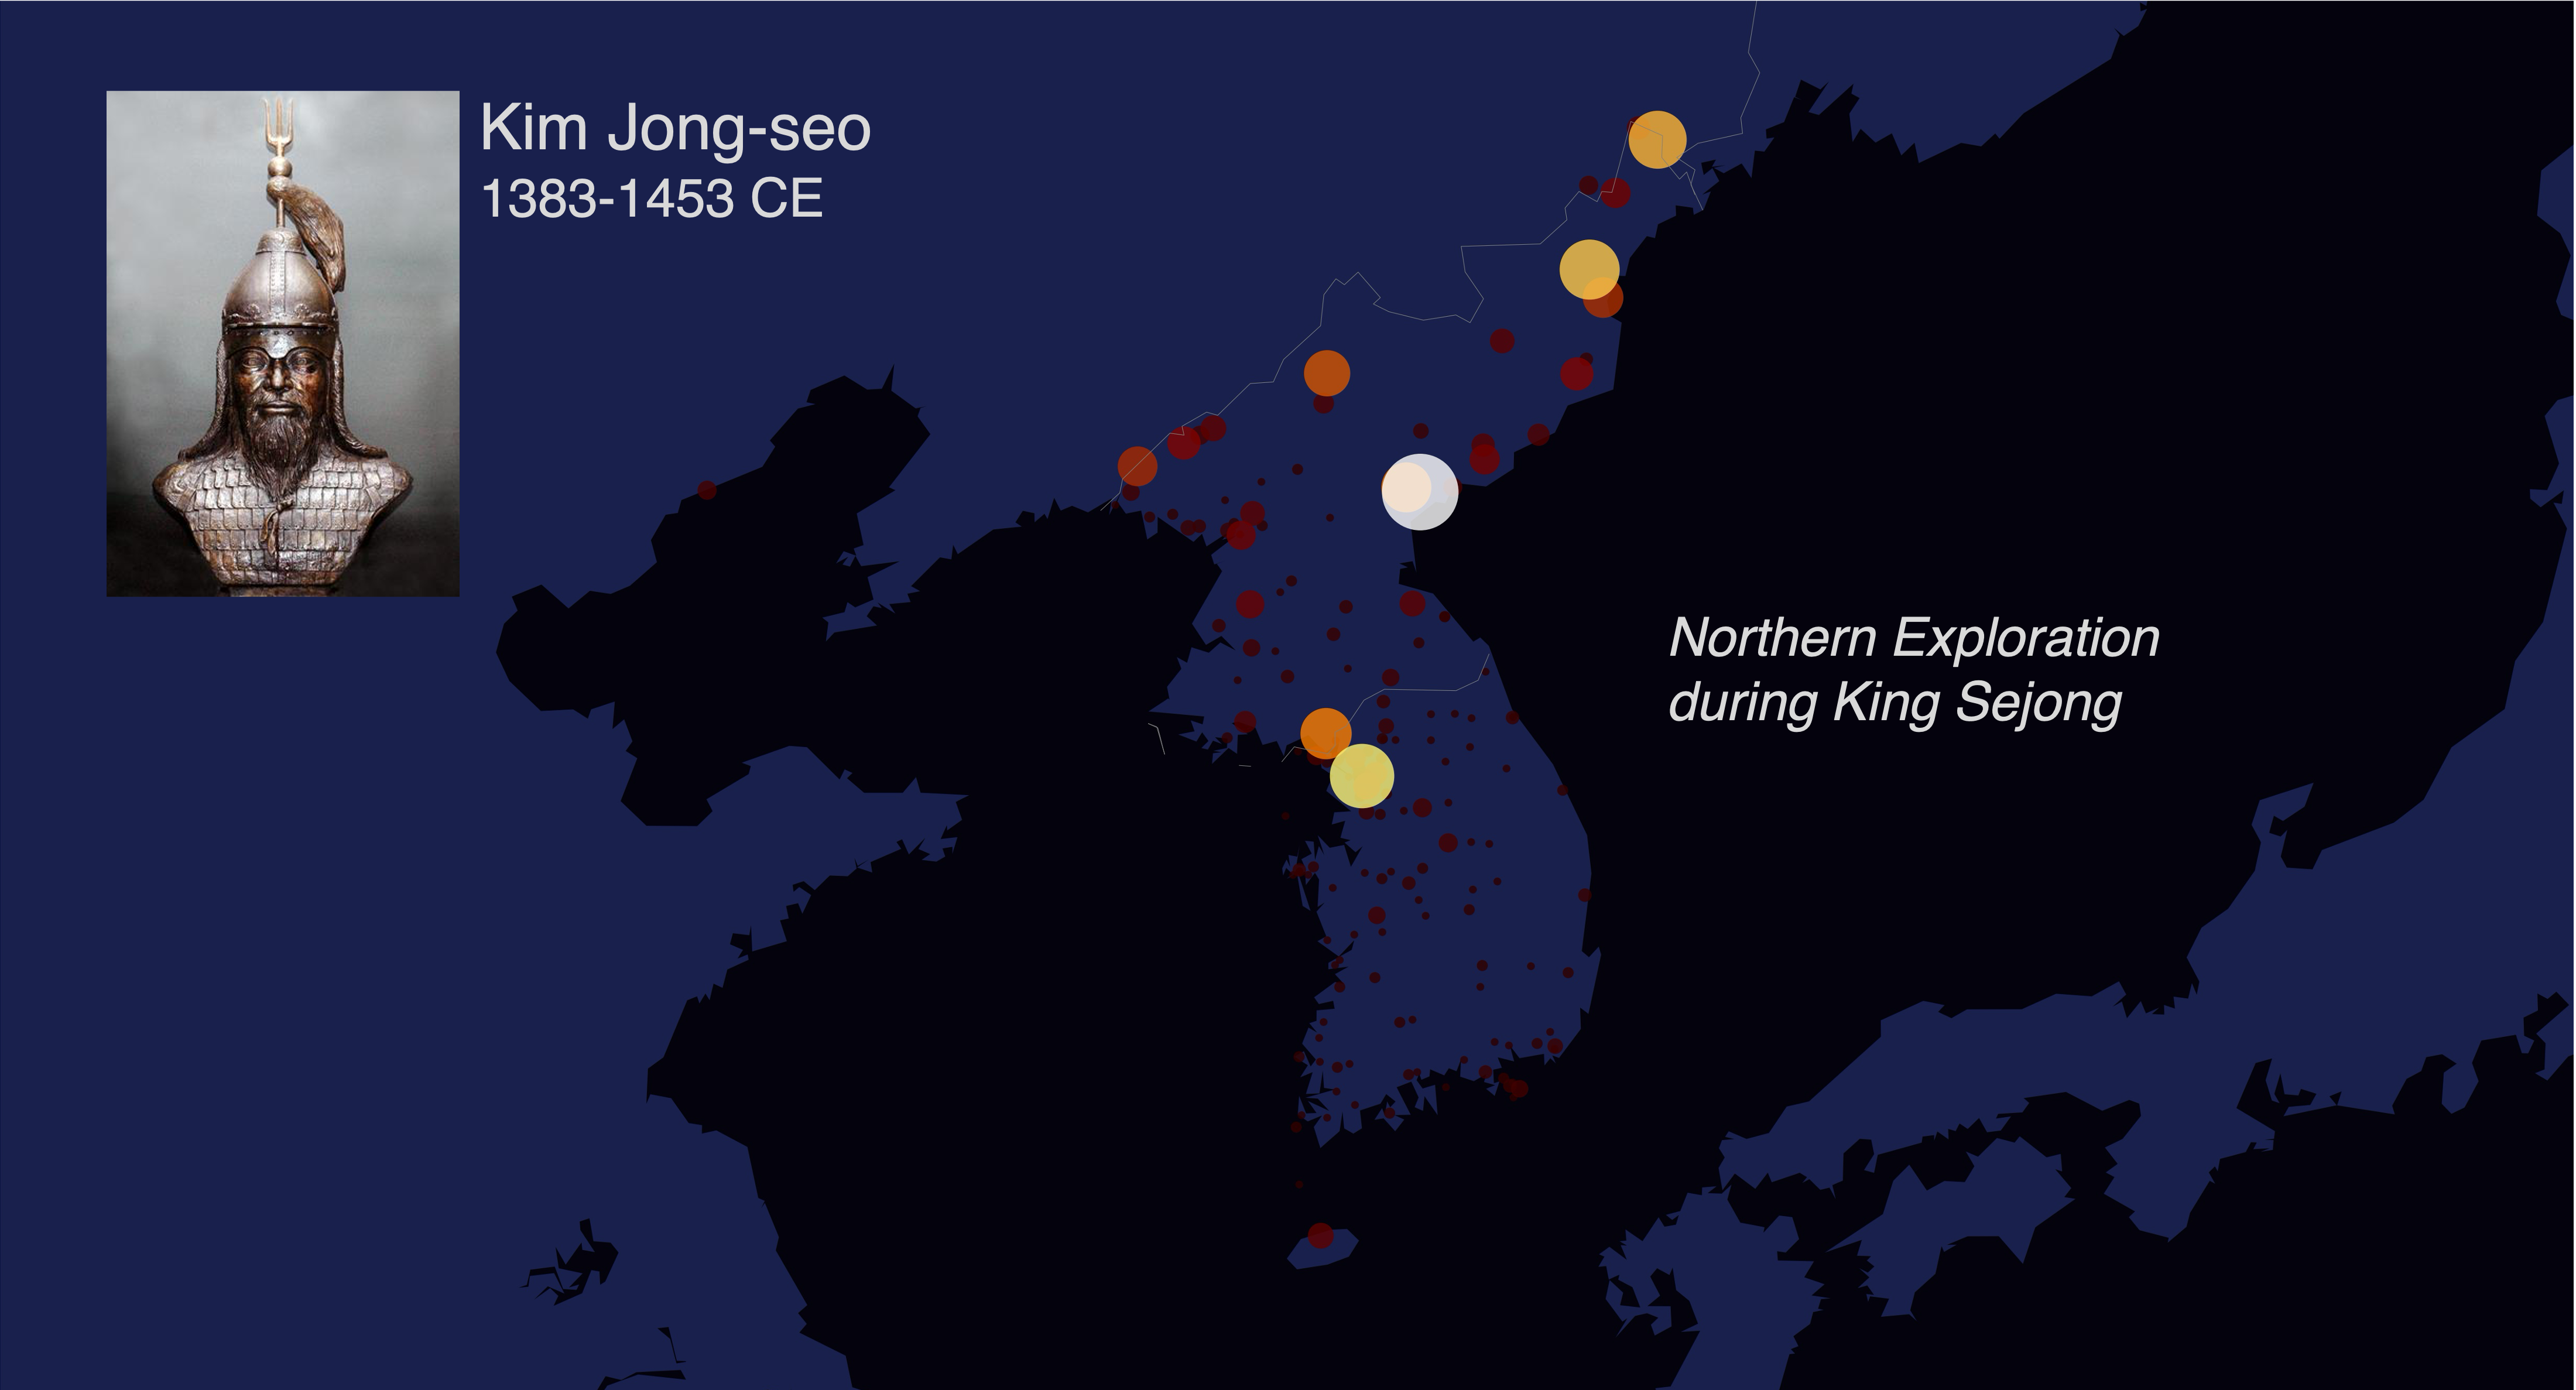
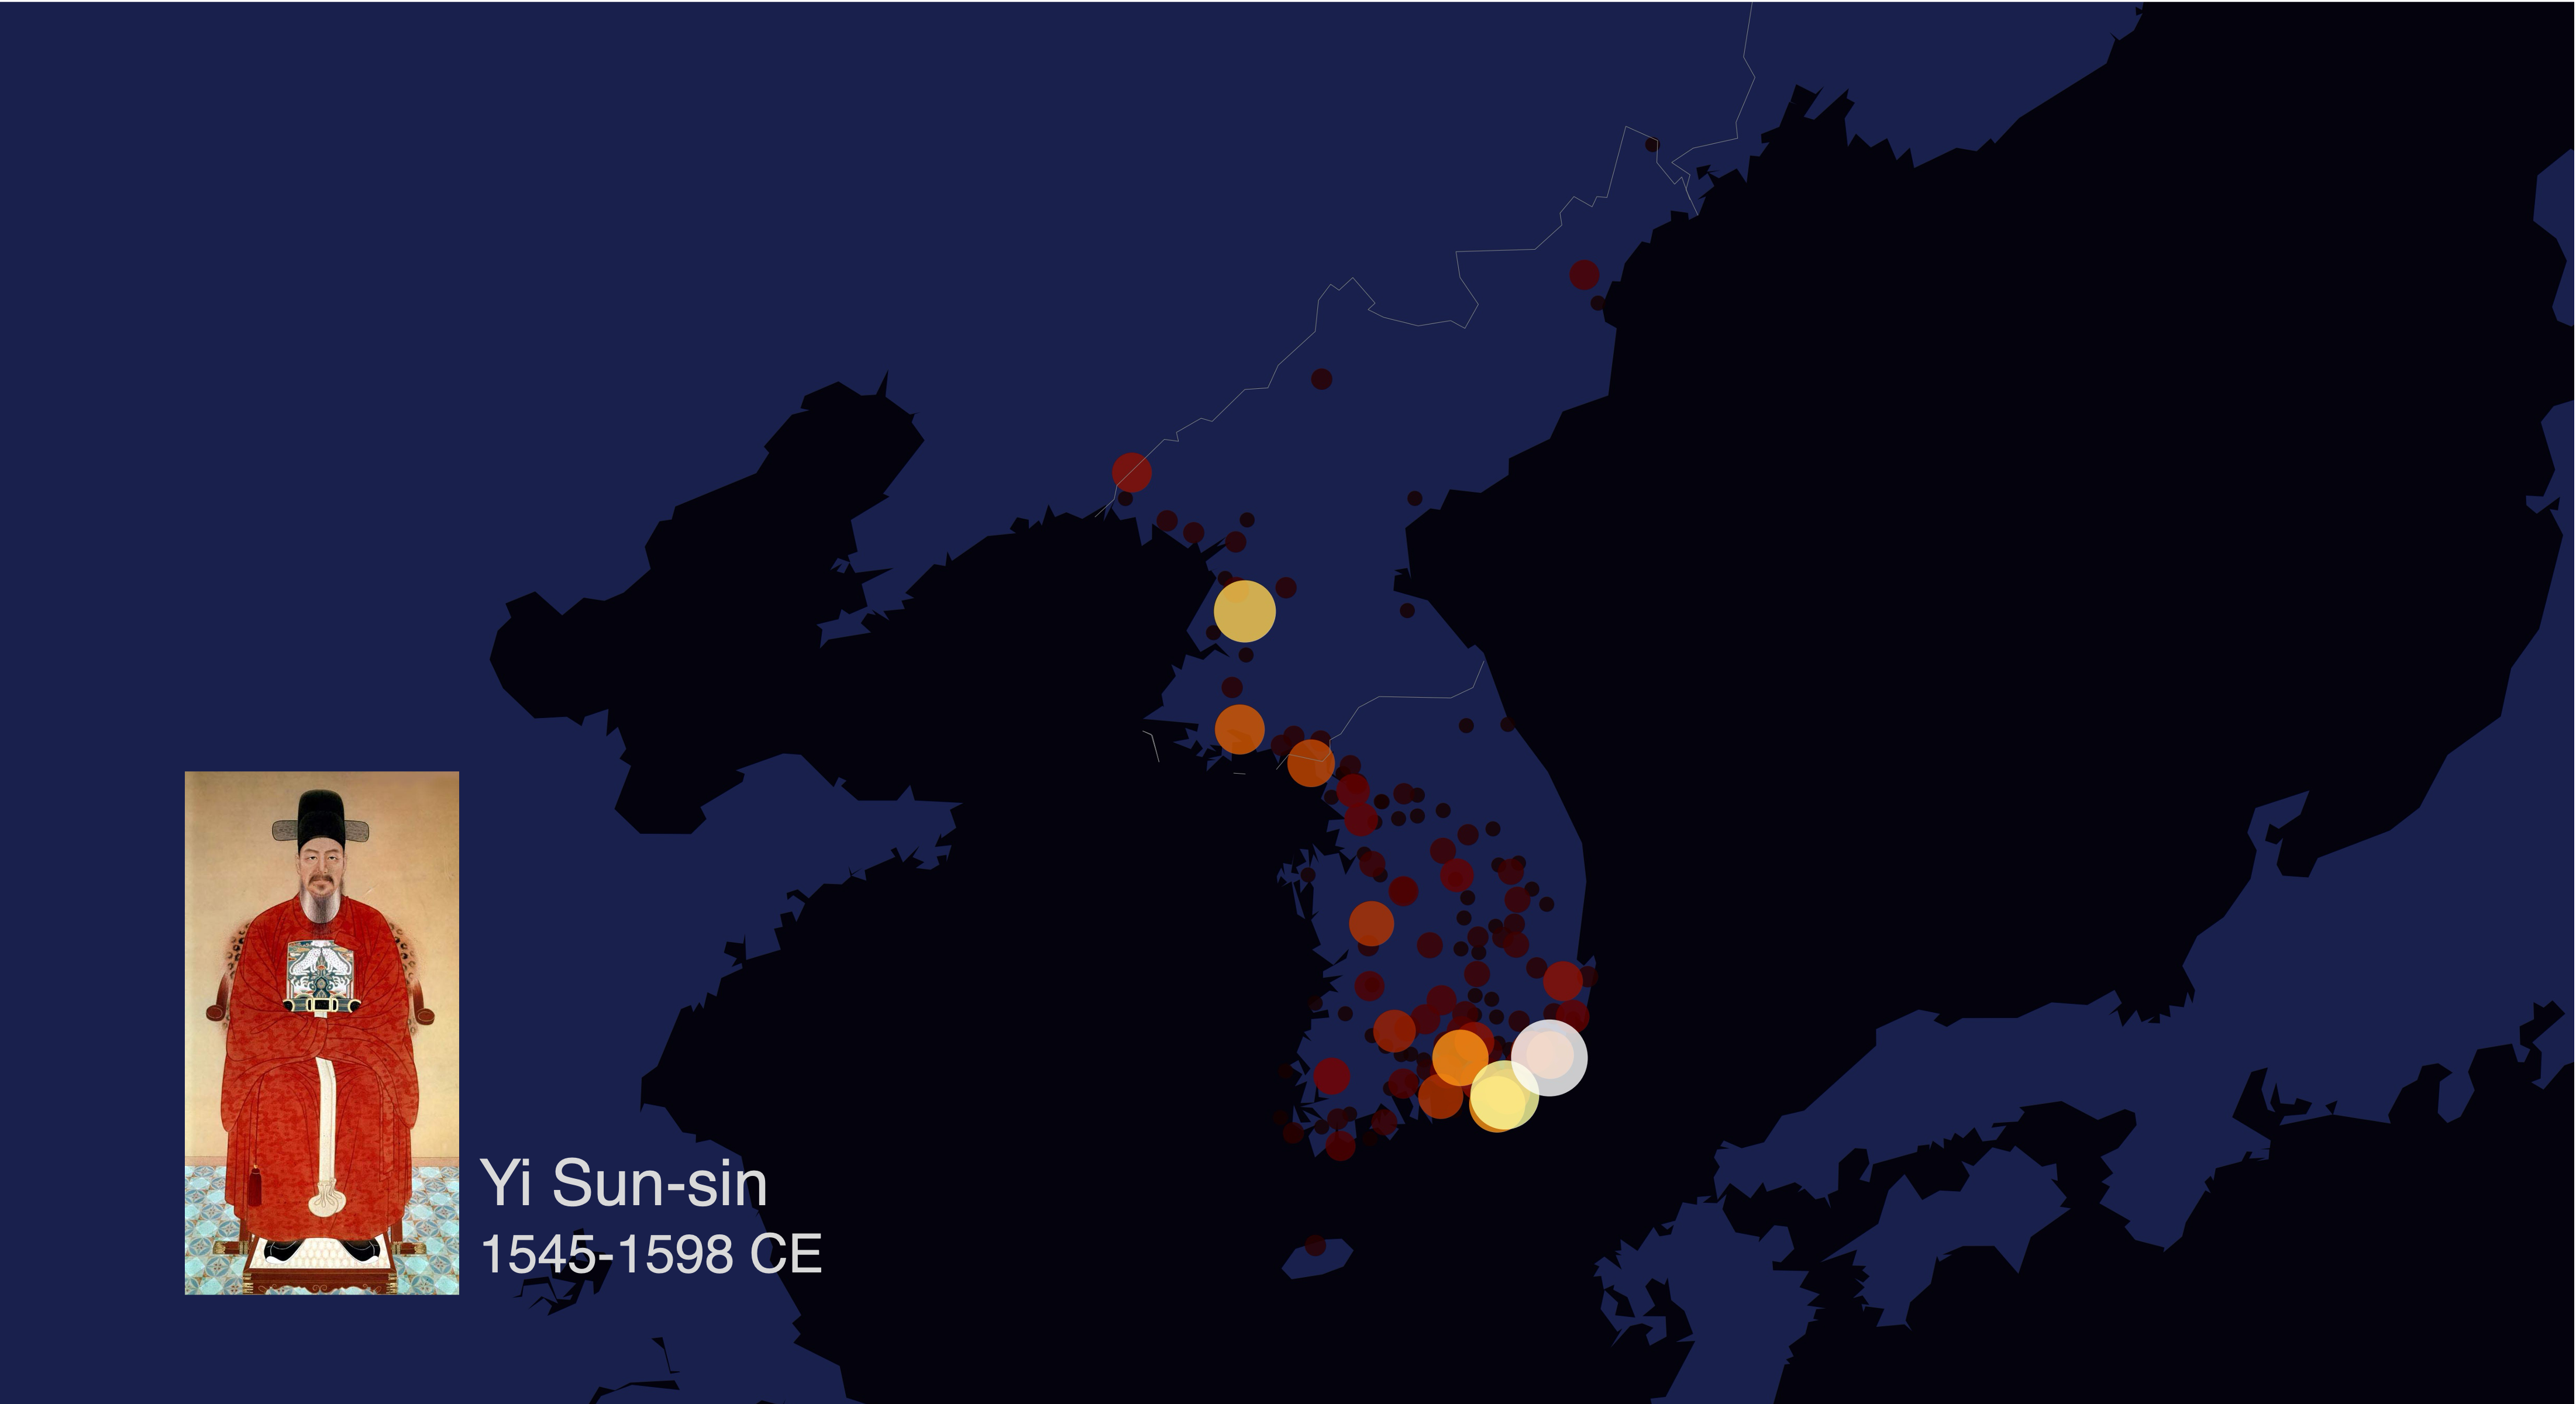
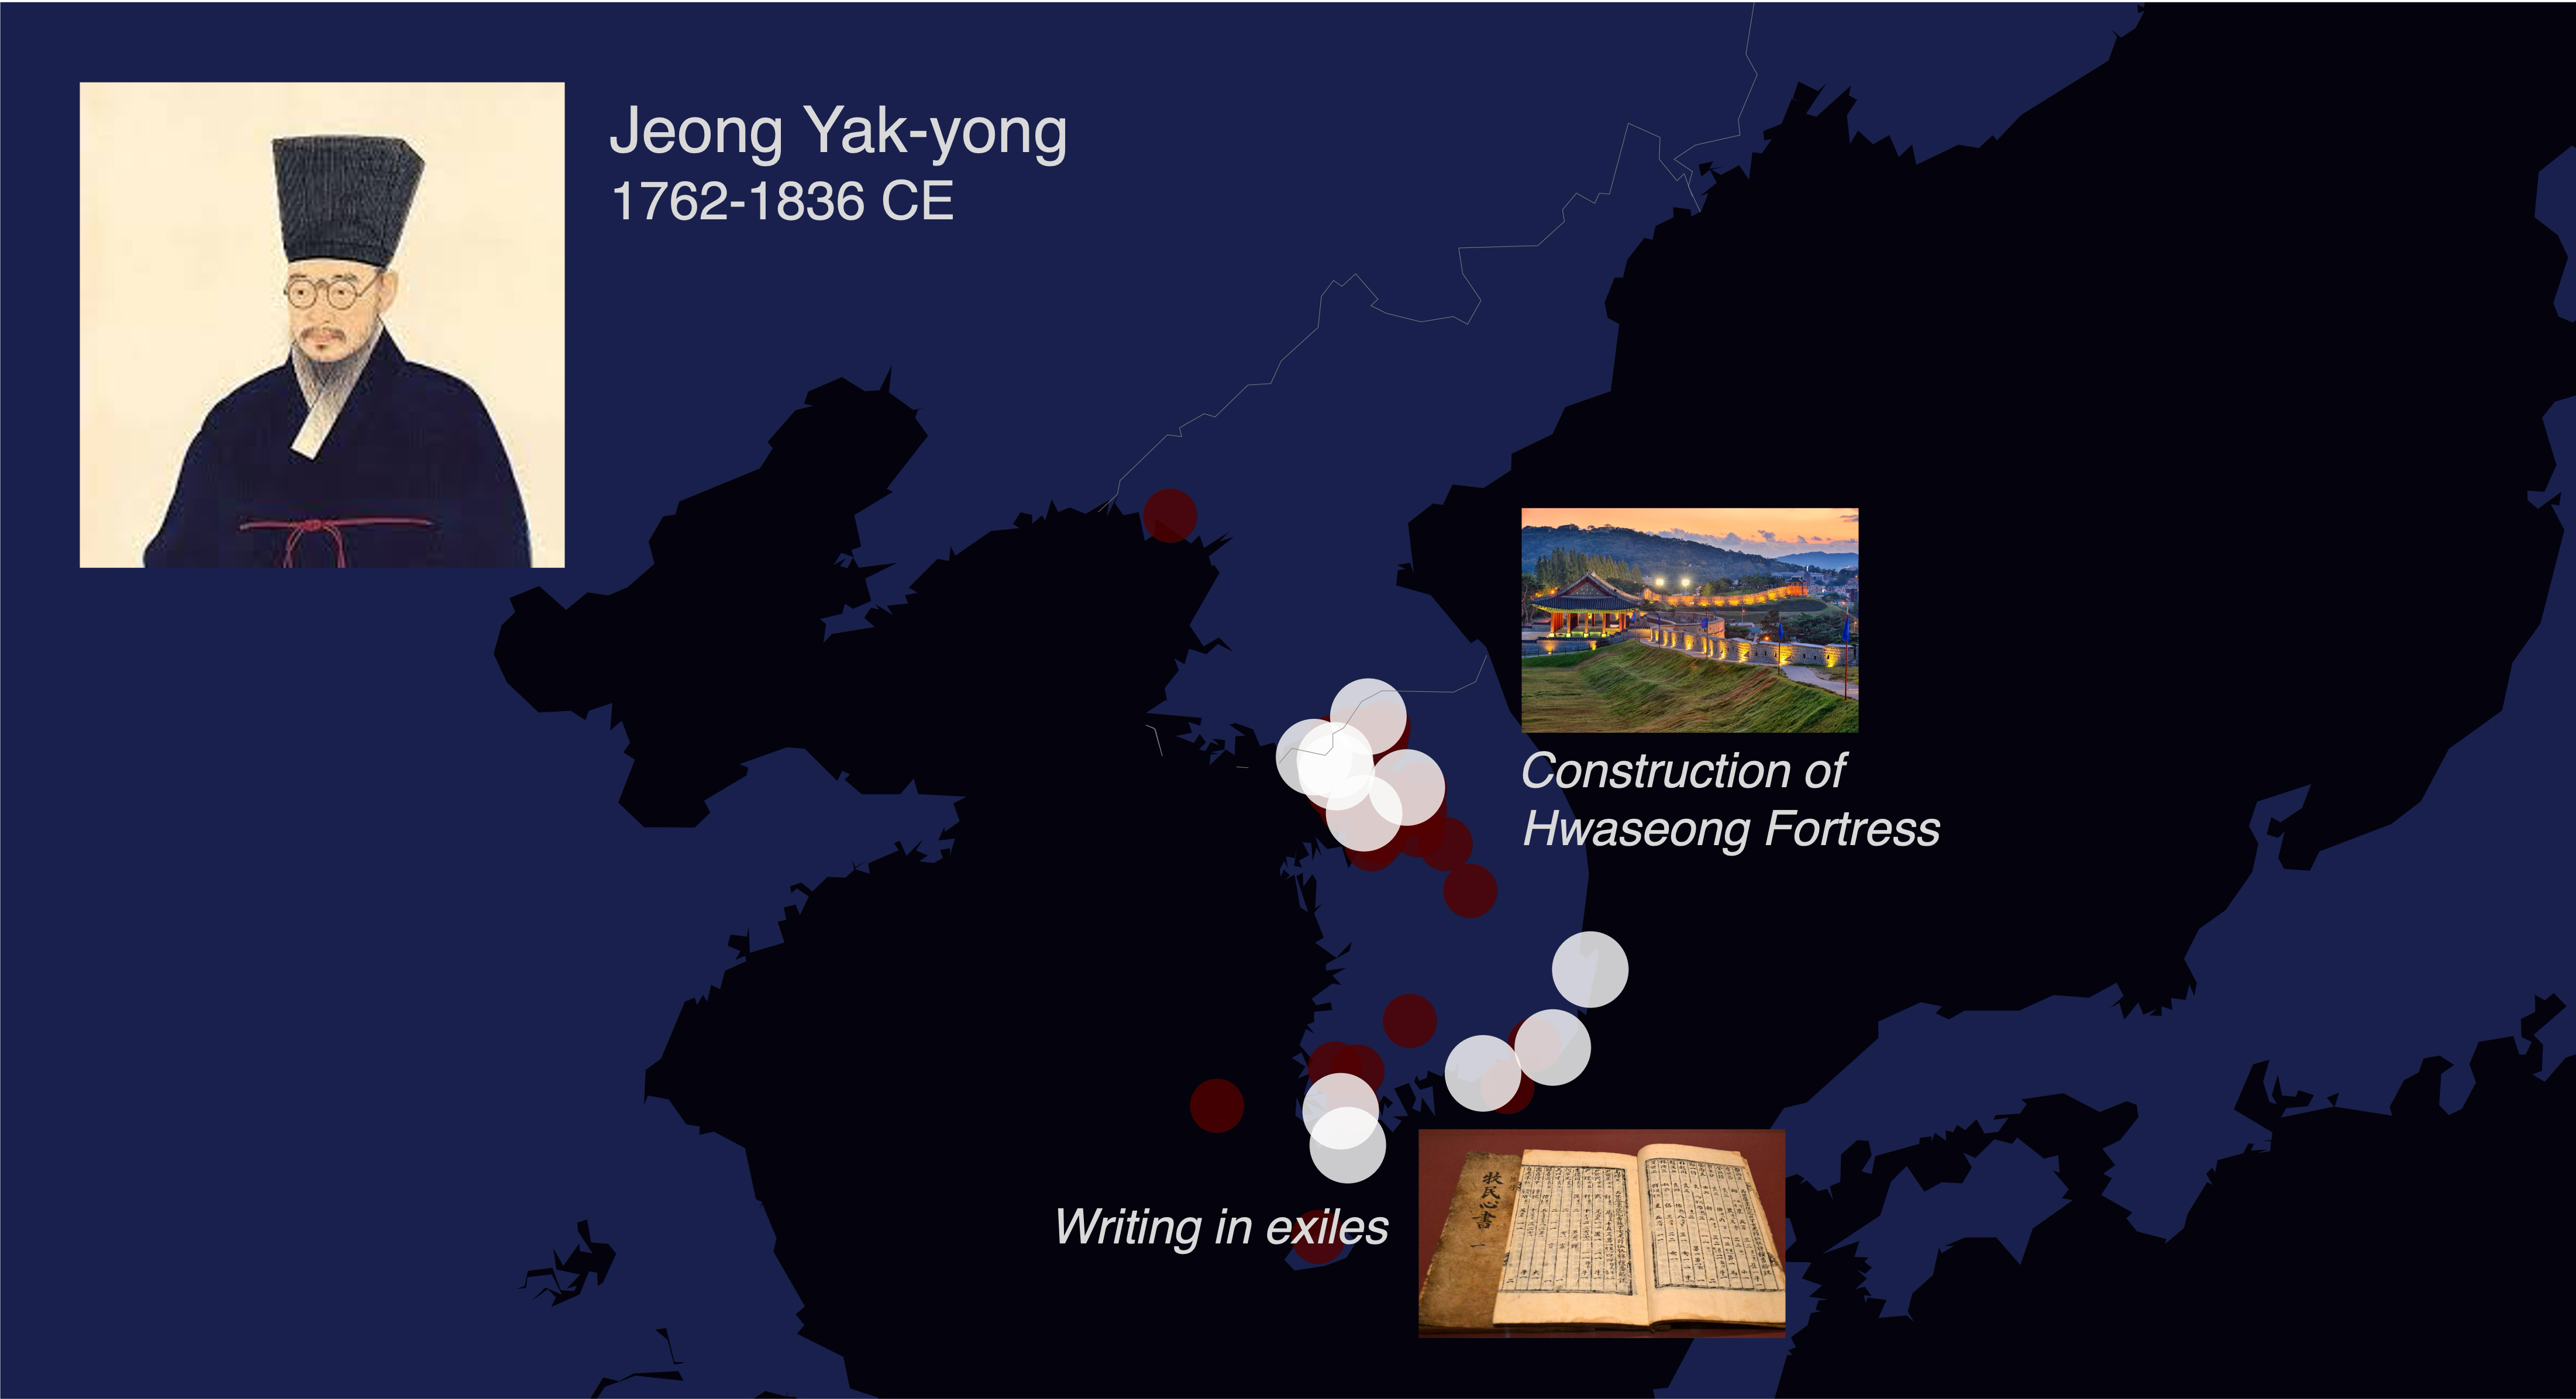
Locations Mentioned with Three Historical Figures (Yi Sun-sin, Kim Jong-seo, Jeong Yak-yong)#
- This section shows the geographic locations mentioned in the same records as each historical figure in the Annals.
- Regions with higher density of associated locations indicate the spatial context and influence of each individual.
Dissecting landscape painting using information theory#
Project Notes#
This film visualizes the process of recursively decomposing paintings using information theory.
Movie by Byunghwee Lee, based on the study “Dissecting landscape art history with information theory” (B. Lee et al., PNAS, 2020).
Full article: https://doi.org/10.1073/pnas.2011927117